The home improvement market is massive and shows no signs of shrinking. Why? Americans are obsessed with DIY, and the rise of Instagram, TikTok, Twitter, and YouTube influencers is fueling that desire.
We decided to look at home improvement statistics, facts, and trends to reveal the truth behind our national obsession.
Key Takeaways
- 38% of U.S. homes were built before 1970, indicating a large number of homes that might need renovation.
- Home improvement searches online doubled from 2020 to 2021, driven by the influence of social media and time spent at home during the pandemic.
- Home Depot and Lowes combined account for 25% of the entire global DIY market, showing the power of these major retailers.
- In 2021, the U.S. home improvement market was worth $1.1 billion, with growth expected to continue in the coming years.
Top 10 Home Improvement Industry Statistics
While there are plenty of facts and stats to get your teeth into, we’ve created a handy list of our favorite 10 home improvement industry facts.
- Thirty-eight percent of U.S. homes were constructed before 1970.
- Online searches for remodels have doubled from 2020 to 2021.
- Seventy-six percent of U.S. homeowners plan to scrap their annual holiday and stay put instead.
- Home Depot has an annual revenue of over £121 billion.
- Over 1,061 people die every year in the U.S. construction industry.
- Social media is driving the growth of the home improvement market via influencers and vloggers.
- Eighty-six percent of global DIY revenue is generated by just 16 percent of the worldwide population.
- 9.8 billion gallons of paint were sold globally in 2019.
- The average American household completed one more DIY task in 2021 than in 2020.
- The U.S. home improvement market grew by $90 billion between 2019 and 2020.
Home Improvement Statistics, Facts, and Trends
While there are many exciting stats about home improvement, we decided to break them down into subsections. Let’s get started.
Home Renovation Statistics
Home renovations are among the most costly DIY projects, but while they may hurt the bank balance, it is satisfying.
1. It’s Just a Number
That’s what people say about age, but what about our homes? Over 80 percent of U.S. homes are over 20 years old. Over 50 percent of homes were built before 1980! That means a lot of housing stock is in need of TLC.
It highlights how old some American homes really are. What’s more, 38 percent were built before 1970. Given that there are approximately 137 million homes in the United States, a massive chunk of them potentially need renovating (1).
2. Kitchen of Your Dreams
According to the National Association of Home Builders (NAHB), the kitchen was the most popular room to receive a renovation in the U.S. Their latest data may date from 2016, but it showed that 81 percent of remodeling experts said the kitchen was top of the list.
Kitchen remodels have risen steadily from 54 percent in 2020 to 77 percent in 2021. Unsurprisingly, the bathroom was the second most popular choice, with 80 percent of the vote.
3. It Starts Online
As we said at the start of this article, the power of social media is driving industry growth. Incredibly, home remodeling-related searches online have almost doubled from 2020 to 2021. This is partly down to the pandemic, with people looking for ways to kill time in lockdown (2).
4. Not All Projects are Big
According to the U.S. Census Bureau, 22 percent of home renovations cost between $5,000 and $15,000. Post-pandemic sales online and in-store have largely been unaffected by COVID because many used their time at home to good effect.
5. Ideal Time
Many people spend the spring months getting their homes summer-ready. Industry experts said the home improvement market expanded by 130 percent between March and May 2021. The second most popular renovation season is winter when people spend more time indoors.
6. Boomers
It appears that the older generation is driving the renovation and remodeling industry. Baby boomers and Gen-Xers made 84 percent of all remodeling projects in 2018. As you go down the ages, the numbers dwindle (3).
Millennial homeowners make up 12 percent of home renovations, spending, on average, $10,000. Just three percent of Gen-Zers tackled DIY projects in the same period, spending an average of $7,000.
The biggest takeaway from these stats is that the older generation is more likely to be homeowners and have the disposable income to complete the work.
7. Couples Can
Married couples are more likely to undertake a home renovation project than single people. This may be an issue of finance rather than marital status because married couples are more likely to own their own home.
8. The Top Five
There are five projects you should undertake to lower your home insurance premium: replace the roof, install smoke sensors, update gas lines, update heating and electrics, and install a generator (4).
Admittedly, most of these are costly, but they may be worth considering if you perform a significant renovation.
9. Staying Put
According to an analysis by the U.S. Census Bureau, an incredible 76 percent of homeowners are staying put instead of traveling for their holidays. That means the travel industry’s loss is the home improvement market’s gain.
The main reason is the post-pandemic travel chaos that has affected several countries. Also, there is nervousness around travel, with people still showing caution at the idea of jumping on a plane and jetting off somewhere sunny.
Instead, they’re spending their money on construction companies, hardware stores, and online sales to improve their homes.
Home Improvement Industry Facts
So, while home renovations are going strong, what is the state of the home improvement industry and its growth predictions?
10. Home Depot
There is no denying the power of some brands in the home renovation industry, and they don’t come any bigger than Home Depot. This DIY behemoth raked in over $121 billion in revenue and is the fourth-largest retailer in the U.S (5).
Home Depot has increased its online presence to give the consumer more choices, and they have large retail stores for the traditionalists among us. It helped the company reach a U.S. market share of 27.2 percent.
11. Bumper Lumber
In 2019, lumber yards across the States collectively made an incredible $137.7 billion. The entire DIY sector is worth $407.1 billion in that same period, and this figure only covers the DIY market share! Someone is buying a hell of a lot of wood (6)!
12. Hardware Stores
Sales from hardware stores accounted for $63 billion in 2021 (7). If you include the data from other retailers like Home Depot, Lowes, and Ace, that figure jumps to $244 billion.
13. Combined Power
Combining the revenue generated by Home Depot and Lowes accounts for 25 percent of the entire global DIY market.
14. Safety First
According to the U.S. Department of Labor, construction is dangerous. They state that 1,061 people lost their lives in the industry in 2019 (8).
The most common causes of fatalities include; electrocution, fatal falls, getting struck by falling or moving objects, and getting crushed.
15. Smart Move
The Internet of Things has transformed the way we live our lives. Intelligent appliances, heating, security, and vehicles allow us to stay connected and for them all to communicate. Imagine your fridge alerting you when you run low on milk.
Smart appliances are here to stay, with the global market size predicted to top $99.41 billion by the end of 2025 (9). What’s more, the global smart security industry is expected to hit $31 billion by 2023.
16. It’s All About Ace
In the customer satisfaction stakes, Ace Hardware comes top. In a 2019 survey, the DIY giant beat the competition by 840 of 1,000 people ranking it the best company in the industry. While the figures are approaching four years old, it is still relevant today (10).
17. What’s a Vlog?
YouTube, Instagram, Pinterest, and other social media platforms drive the home improvement industry. Almost 47 percent of people began a DIY task after watching a YouTube vlog (video blog) or seeing images on other social media platforms.
No wonder Instagram’s advertising revenue hit $20 billion in 2019! All those influencers are an advertiser’s dream.
18. Good for the Planet
It seems that the majority of DIYers are eco-friendly. Almost 65 percent of enthusiasts said they would pay extra for their materials and tools if they were produced ethically and sustainably.
DIY Home Improvement Facts
What DIY projects do Americans love to do, and what are the interesting stats relating to the DIY market?
19. Fastest Growth
The amount spent on home improvements is growing at twice the rate of other retail sectors. The pandemic is largely to blame for people spending more time at home and realizing their spaces don’t fit their lifestyles (source).
Given that people are traveling less, more money is available for DIY projects to adapt interiors and exteriors.
20. Reduced Credit
Consumer credit relating to DIY has reduced by 30 percent during 2020/2021. This is because of market volatility and the fear of a looming recession. People used to finance their projects on credit, now many choose to pay outright.
Take Note
Almost 40 percent of homeowners admit to paying for their projects in cash rather than using credit.
21. Increasing Value
A staggering 36 percent of American households took on a DIY project with the sole aim of improving their internal and external spaces. Twenty-nine percent did it to repair worn-out fixtures and fittings. Just 12 percent said they did the work to increase the house value.
22. Top Eight
The U.S., U.K., Japan, Germany, France, Australia, Canada, and Italy are the eight biggest DIY markets on the globe. They account for a massive 81 percent of the global market. France, Germany, and the UK make up 50 percent of the European market.
23. How Much?
The global DIY market was worth a staggering $762 billion in 2020, and is expected to grow by 4.3 percent to reach a staggering $1,009 billion by 2027 (11).
Interesting Fact
Eighty-six percent of the global DIY revenue is generated by just 16 percent of the worldwide population.
24. So Much Paint
In 2019, 9.8 billion gallons of paint were sold, with a value of $158 billion. That’s enough paint to fill 200 million standard bathtubs (12).
25. Time to Paint
Painting is one of the most popular DIY tasks we perform in American homes. Fifty-five percent of us are planning an interior paint refresh in the next year, while 33 percent are planning a bathroom remodel.
26. Tool Market
The DIY tool market was worth a staggering $14 billion in 2021. Since the pandemic, growth has been even stronger. Forty percent say they have taken up a hobby or project involving using tools during the pandemic.
A further 59 percent said they would commit funds earmarked for other expenses towards a new DIY project.
Home Improvement Trends in 2022
So, we’ve talked about the current state of the markets and looked at the DIY habits of Americans, but what about the trends for 2022? Let’s take a look.
27. Increased Costs
Spending is predicted to increase by 30 percent in major U.S. cities like Austin, Texas, and Fort Myers, Florida. This is partly due to the increased urbanization of larger cities and higher disposable income (13).
28. Remodel Success
The U.S. home remodel industry made $1.1 billion in 2021, with growth expected to hit 4.1 percent from 2021 to 2027. This growth is primarily due to increased smart technology sales and rental landlords improving their housing stock.
29. Just One More
The average American homeowner completed one more DIY task in 2021 than they did the year before. On average, 2.7 projects were completed in 2020, compared to an average of 3.7 in 2021. Each project costs an average of $2,800.
30. The Great Outdoors
It’s not just our indoor spaces getting a makeover; the percentage of people updating outdoor areas rose from 56 percent in 2019 to 57 percent in 2020. While it is modest growth, it is an upward trend.
31. Got the Time and Money
Forty-four percent of homeowners who completed a DIY project in 2020 said they had always intended to do the work, but now had the free time due to the pandemic.
Twenty-two percent said that they had the money to complete the home improvement in 2020 where they didn’t before. Eighteen percent said they did it to adapt their space to fit their lifestyle.
32. In the Business
There are 493,728 remodeling companies in the U.S. in 2022. That’s an increase of 120,000 new businesses in 10 years! Growth has been steady at 3.8 percent year on year from 2017.
33. Record Numbers
The U.S. home improvement market increased by $90 billion between 2019 and 2020. It is likely to grow, reaching $620 billion by 2025. Forecasts predict that the global home improvement industry will top one trillion dollars by 2027.
This rapid growth is in stark contrast to the $30 billion drop the market experienced in 2007/8. It is thought that the global financial crash was to blame. Similarly, the pandemic is mainly responsible for the jump between 2019/20.
Average Cost Per Home Improvement Project
Here’s a handy at-a-glance guide showing the average prices paid for typical home improvement tasks.
| Project Type | Average Cost |
| Low-end kitchen remodel | $22,000 |
| Mid-price kitchen remodel | $64,000 |
| High-end kitchen remodel | $126,000 |
| Bathroom remodel (mid to high) | $20,000 to $63,000 |
| Interior painting | $3,200 |
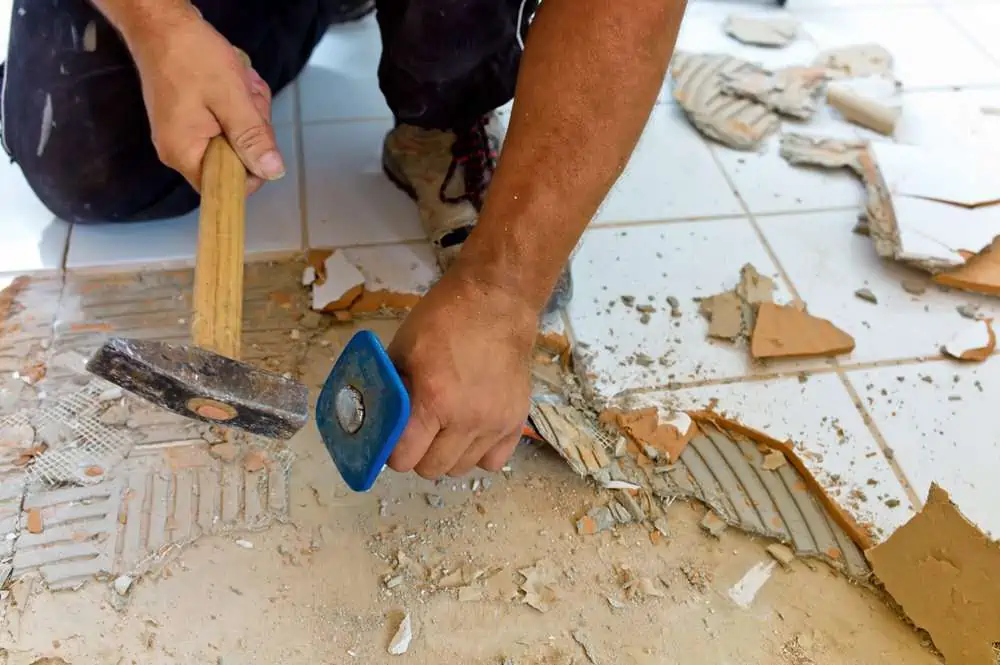
| Replacement floor | $18,500 |
| Attic finish, including bathroom | $47,000 |
| Basement finishing with bathroom | $57,000 |
| Wood window replacement | $19,500 |
| Vinyl window replacement | $16,000 |
| Roof replacement | $23,000 |
FAQs

Is It Better to Fix Up a House or Buy a New One?
It depends on what you want. If you are desperate for a change of scenery, no matter how often you fix up your house, it is still the same house. Alternatively, it’s far cheaper to fix up an existing property than buy a new home to discover the issues are far greater than first thought.

How Often Do Americans Remodel Their Homes?
Most Americans remodel their homes on average every three to five years, with 40 percent stating that they intend to undertake a remodel within two years.

What is the Best Month to Renovate a House?
The best months to renovate your home are winter and March to May, in readiness for the summer season.

What Home Improvements Add the Most Value to a House?
New kitchens and bathrooms are among the most popular home improvements, with an excellent return on investment. Similarly, replacing a roof or installing double glazing is also good for improving the value.

How Many Home Improvement Contractors Are in the US?
There are approximately 6,200 home improvement contractors working in the U.S. as of 2024.
Final Thoughts
So, you have a comprehensive guide to home improvement statistics, facts, and trends. We bet some of the stats surprised you, especially the size of the global markets. And the great news is the industry shows zero signs of flagging, especially post-pandemic.